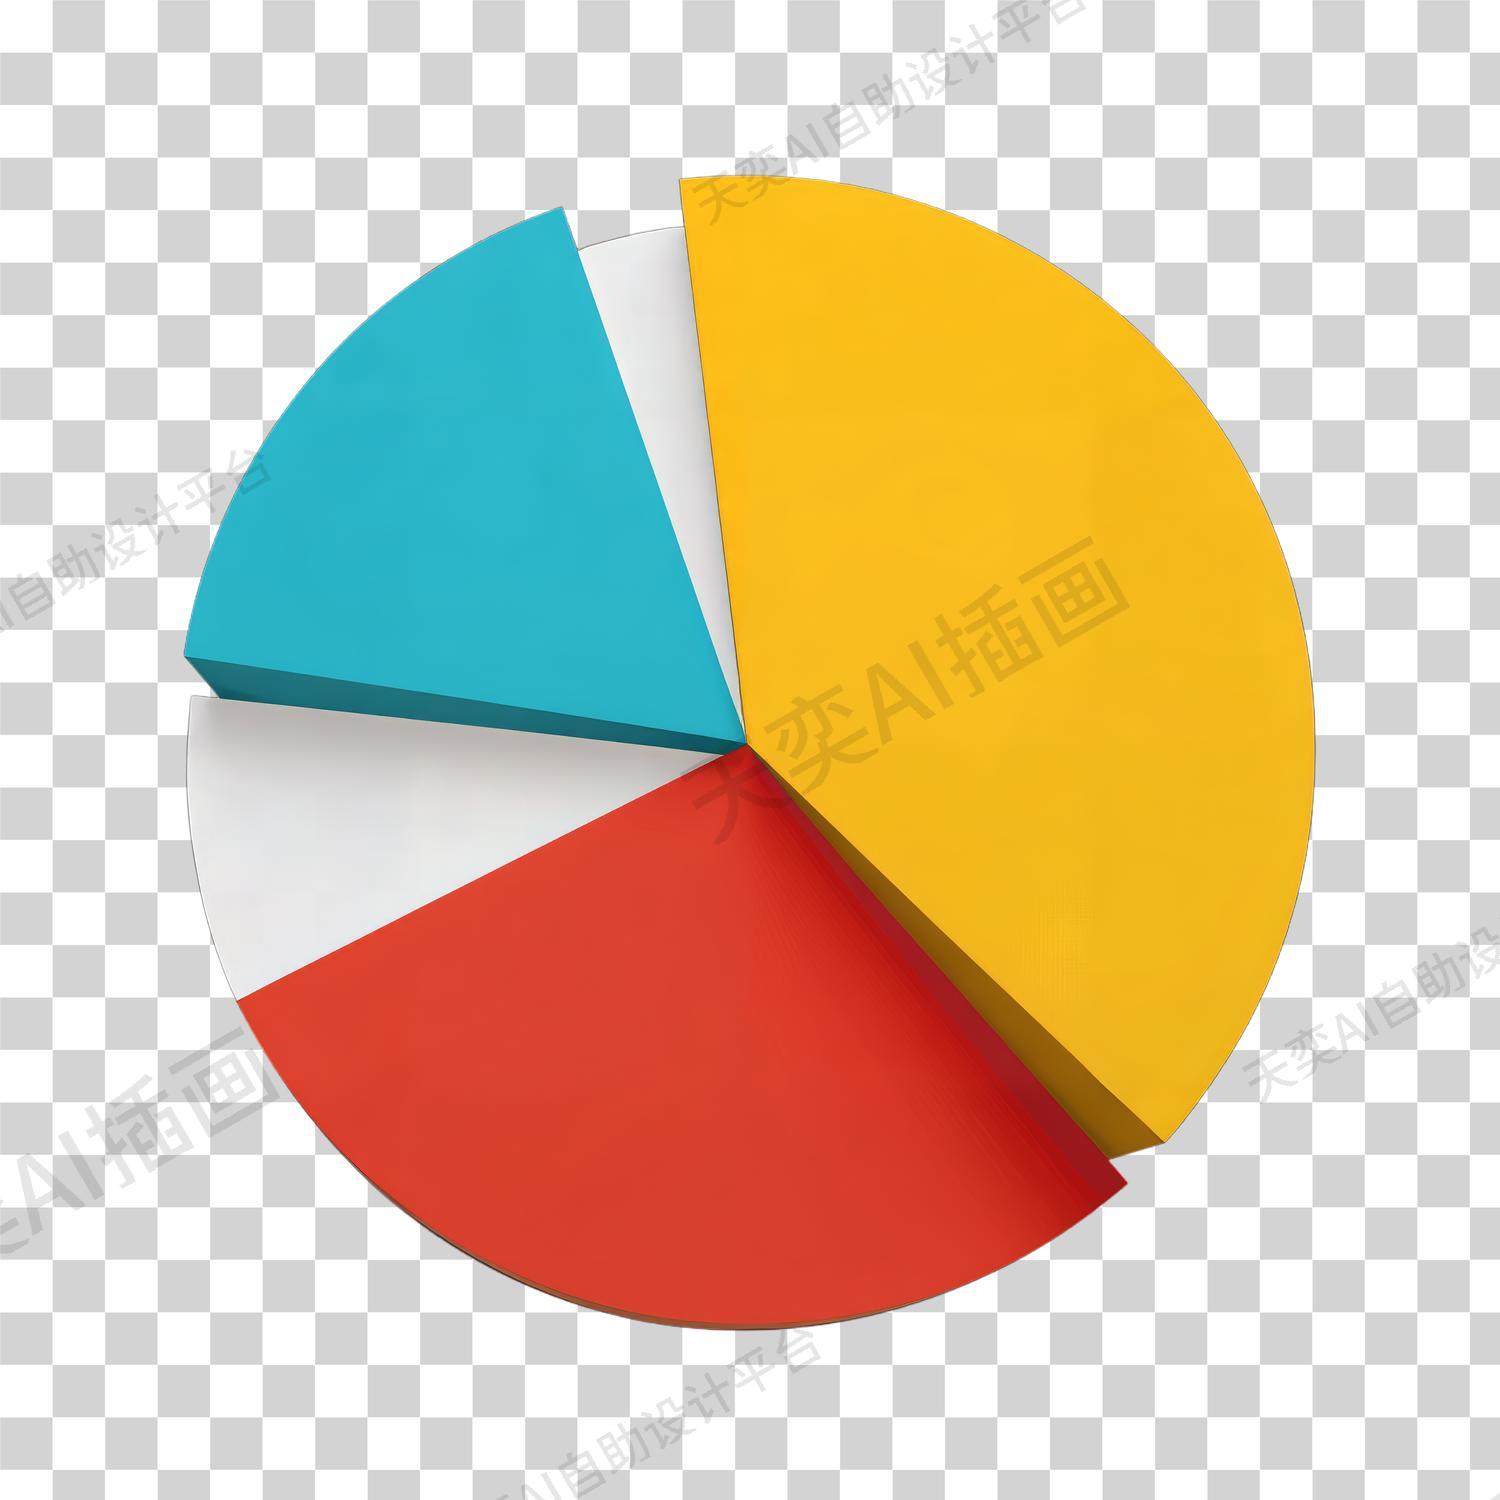
这个圆形图表使用鲜艳的颜色块构成,视觉效果十分生动有趣。图表能够清晰展示各部分占比情况,便于快速理解数据信息。其简洁优雅的设计也符合当下信息可视化的趋势,是一个非常实用的数据分析工具。

表示感谢!
Give thanks to @天弈设计AI for sharing this photo, the easiest way, sharing on social network
